First of all, we need a profiling enabled kernel configured and build. First step is to use config utility. Now, we need to run config utility from our kernel source configuration directory. I'm using a i386 system. The conf file directory depends on your architecture.
The default directory is /usr/src/sys/ARCH/conf. In my case it's /usr/src/sys/i386/conf/.
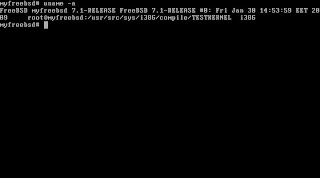
We run config utility from where our kernel conf file resides with parameter -p. This tell's the compiler to compile our kernel for low resolution profiling. If we need a high resolution profiling we need to run config with -pp parameter instead of -p. config utility needs a second parameter called SYSTEM_NAME. This is our default system name. FreeBSD's default system name is GENERIC. This can be different on your system, if you build a new kernel with different config file. Older versions of freebsd default GENERIC kernels was not using smp. So it's possible to you have build a new kernel for smp.Therefore you can have a custom build kernel on your system or for another reason. You can see your default system name by using "uname -a" command.
Here is mine is called TESTKERNEL. You'll probably see GENERIC in your case.

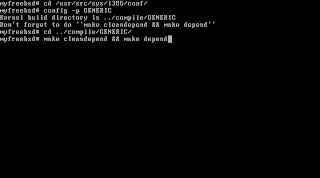
After learning you SYSTEM NAME, it's now time to configure our kernel source for profiling. The following picture shows you how to run config with -p option on i386 arch with GENERIC system name.

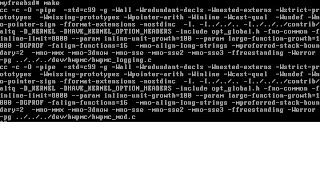
After running "make cleandepend && depend" command, we run the "make" command on the same directory and it will built a profiling enabled kernel for us.

After the make command, we have build our kernel, now run "make install.debug" command and it will install our debug kernel.
Now, it's time to reboot our machine. After rebooting check kernel messages for following message to see if build is successful for profiling enabled kernel Addresses should be different but seeing message "Profiling kernel" means it's ok.
Profiling kernel, textsize=6845824 [c045cbe0..c0ae4160]
It's time to run kgmon to collect profiling data on our kernel.
# kgmon -b
Now kernel profiling is running for low profiling. For high profiling -B option must be used and don't forget you have to use config -pp for high profiling.
You can now, run the application which was causing the problems on your system to profile it, or create the same situation on server where you were having problems.
Now, after creating and seeing the problem, let's kgmon to dump the profiled kernel data.
# kgmon -p
As I said before, kgmon will create a file called gmon.out for profiled data in gprof format.
Now, we gathered our data, we can now stop profiling.
# kgmon -h
We collected the data we need. Let's see what the gmon.out file contains.
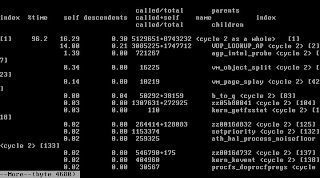
# gprof /boot/kernel/kernel gmon.out
Here is a snippet from gprof output.

I'll explain the meaning of the gprof output in another post.
NOTE: you can apply this technique to other freebsd deriatives like dragonfly bsd and netbsd.
1 comment:
Hi,
Thanks for the well written article. I wanted to know If we could enable kgmon from boot time, i.e. during FreeBSD boot time. Is there a
kgmon -b
and
kgmon -h
equavalent code available during boot time? so that I can start profiling my code from the boot time itself?
Thanks a lot!
Post a Comment