In my previous post, I explained basic arrays usage in bash shell. Now, I'll show more advanced topics with bash arrays.Let's create a simple array called myarray.
# myarray=(first second third fourth)
Now, assume that you want to learn string length of second element of myarray.
# echo ${#myarray[1]}
this will 6 for string "second".Note here that, array indexes are starting from 0. So, 1 index numbers actually is 2nd element of the array.
Here is another example, this one will skip first element of the array and gives rest of the array.So,following will do the trick.
# echo ${myarray[@]:1}
going further with this example.Let's say we want to skip first element and need no more than 2 elements in the array
# echo ${myarray[@]:1:2}
result will be "second third".
Search and Replace
You can search and replace patterns or characters in given array or any array element.
Here is two examples, first one will search all elements of array for character "r" and replace all characters with "R". Second example, will do the same thing but only for 2nd element of the given array.
# echo ${myarray[@]/r/R}
# echo ${myarray[1]/r/R}
Above examples, will only replaces first occurrences, for replacing whole occurrences use double slashes.For example,
# echo ${myarray[1]//r/R}
Deleting and Adding Array Elements
Deleting any element is very simple. You just have to use "unset" command and give index number of array element.Following, will delete 2nd element of the array.
# unset myarray[1]
now our example array will contain "first third fourth" elements.Deleting the whole array is very simple.Don't pass the index number to unset.
# unset myarray
Now, Let's a new entry to our array.
# myarray=("${myarray[@]}" "fifth_element")
Tuesday, February 10, 2009

Saturday, February 7, 2009
substring operation with bash
You can get a substring (substr) value of an string variable as following in bash.
Syntax is simple ${VARIABLE_NAME:start:length}
let's assume we have a string variable called mystring and it has the value "test".
mystring="test"
If you want to access first character of the string you can use following statement.
c=${mystring:0:1}
now c value contains "t" character.
c=${mystring:2:2}
Now c contains "st" substring.
Hint: You can calculate the length of a string value as follows.
${#mystring}
Syntax is simple ${VARIABLE_NAME:start:length}
let's assume we have a string variable called mystring and it has the value "test".
mystring="test"
If you want to access first character of the string you can use following statement.
c=${mystring:0:1}
now c value contains "t" character.
c=${mystring:2:2}
Now c contains "st" substring.
Hint: You can calculate the length of a string value as follows.
${#mystring}
Friday, February 6, 2009
Mysql General Query Log
Before Mysql version 5.1.6, you can only log to files what mysqld was doing. 5.1.6 comes with an option where it let's you keep this log in a table called mysql.general_log. Even further, version 5.1.12 came with a new ability to let you disable general query logging on the fly.
You can enable/disable mysql general query logging by setting global variable "general_log".For example following command, starts general logging on the fly.
SET GLOBAL general_log = 'ON';
You have to options, either you can log the queries on in a file where it was the only option before version 5.1.6 , or you can log in the table I mentioned above called mysql.general_log by using global variable "log_output".
The following statement tells mysql to log queries in table mysql.general_log instead of a file.
set global log_output='table';
In any time, you can truncate the table to delete it's contents.

After logging the queries, you can see them by simply using a select statement.
select * from mysql.general_log;
to make it more readable you can use \G at the end of the query.
select * from mysql.general_log\G;

You can enable/disable mysql general query logging by setting global variable "general_log".For example following command, starts general logging on the fly.
SET GLOBAL general_log = 'ON';
You have to options, either you can log the queries on in a file where it was the only option before version 5.1.6 , or you can log in the table I mentioned above called mysql.general_log by using global variable "log_output".
The following statement tells mysql to log queries in table mysql.general_log instead of a file.
set global log_output='table';
In any time, you can truncate the table to delete it's contents.

After logging the queries, you can see them by simply using a select statement.
select * from mysql.general_log;
to make it more readable you can use \G at the end of the query.
select * from mysql.general_log\G;

arrays in bash shell
BASH shell is very powerful script language. In my previous blog posts, I give some detail about bash regular expression support. In this post, I will give some information about bash array support.
Declaring an array is very simple in bash. Here is some examples.
# declared an array named called "array" and containing elements.
# "This", "is", "an", "array"
array=(This is an array)
# declaring an array called a by giving elements one by one.
a[0]="123"
a[1]="abc"
a[2]="xyz"
# get output of an df -h
myarray=($(df -h))
Reading value element of an array is in following syntax ${array[#index_number]}. Please note the curly bracket notation.
# print element number 2 of array called myarray
echo ${myarray[2]}
# print all elements
echo ${myarray[*]}
# print index numbers of array
echo ${!myarray[*]}
# number of elements in array
echo ${#myarray[*]}
Here is a simple script using arrays. It simply reports the file systems where disk usage is
over 90% percent.
#!/bin/bash
(df -h|grep "^/") | while read d; do
array=( $d )
array[4]=${array[4]%\%}
if [ ${array[4]} -gt 90 ]; then
echo "${array[5]} is over limit. current size is ${array[4]}%"
#do whatever you want here, for example send an email to warn sysadmin about high disk usage.
fi
done
Declaring an array is very simple in bash. Here is some examples.
# declared an array named called "array" and containing elements.
# "This", "is", "an", "array"
array=(This is an array)
# declaring an array called a by giving elements one by one.
a[0]="123"
a[1]="abc"
a[2]="xyz"
# get output of an df -h
myarray=($(df -h))
Reading value element of an array is in following syntax ${array[#index_number]}. Please note the curly bracket notation.
# print element number 2 of array called myarray
echo ${myarray[2]}
# print all elements
echo ${myarray[*]}
# print index numbers of array
echo ${!myarray[*]}
# number of elements in array
echo ${#myarray[*]}
Here is a simple script using arrays. It simply reports the file systems where disk usage is
over 90% percent.
#!/bin/bash
(df -h|grep "^/") | while read d; do
array=( $d )
array[4]=${array[4]%\%}
if [ ${array[4]} -gt 90 ]; then
echo "${array[5]} is over limit. current size is ${array[4]}%"
#do whatever you want here, for example send an email to warn sysadmin about high disk usage.
fi
done
Tuesday, February 3, 2009
Solaris pargs command
Solaris pargs gives you environment and arguments information for any given process id. If you pass just a process id (pid) to pargs, it gives you all argument variables of the running process. If you need to have arguments as a single line for using it with for example on shell use -l argument with it. Also pargs can give you environment information of any running process if you run it with -e parameter.
Sometimes this utility can be handy if you cannot see the parameters or environment variables of a process with other methods like ps or any other well known utilities.
 pargs
pargs
Sometimes this utility can be handy if you cannot see the parameters or environment variables of a process with other methods like ps or any other well known utilities.
 pargs
pargs
Friday, January 30, 2009
FreeBSD kernel profiling with kgmon
Sometimes, it's not possible to find a system bottleneck by profiling and debugging user space processess. You have to profile the kernel to pinpoint the perfomance bottleneck. Here, I will show how to configure a freebsd system for kernel profiling and using kgmon utility to gather kernel profiling data. kgmon produces gprof compatible output. The default output file is called gmon.out .
First of all, we need a profiling enabled kernel configured and build. First step is to use config utility. Now, we need to run config utility from our kernel source configuration directory. I'm using a i386 system. The conf file directory depends on your architecture.
The default directory is /usr/src/sys/ARCH/conf. In my case it's /usr/src/sys/i386/conf/.
We run config utility from where our kernel conf file resides with parameter -p. This tell's the compiler to compile our kernel for low resolution profiling. If we need a high resolution profiling we need to run config with -pp parameter instead of -p. config utility needs a second parameter called SYSTEM_NAME. This is our default system name. FreeBSD's default system name is GENERIC. This can be different on your system, if you build a new kernel with different config file. Older versions of freebsd default GENERIC kernels was not using smp. So it's possible to you have build a new kernel for smp.Therefore you can have a custom build kernel on your system or for another reason. You can see your default system name by using "uname -a" command.
Here is mine is called TESTKERNEL. You'll probably see GENERIC in your case.
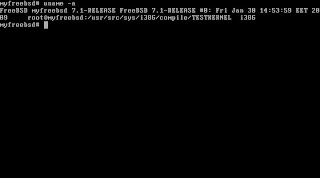
After learning you SYSTEM NAME, it's now time to configure our kernel source for profiling. The following picture shows you how to run config with -p option on i386 arch with GENERIC system name.
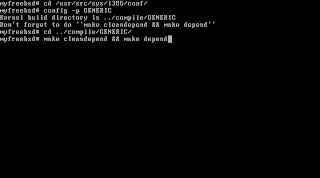
After running "make cleandepend && depend" command, we run the "make" command on the same directory and it will built a profiling enabled kernel for us.
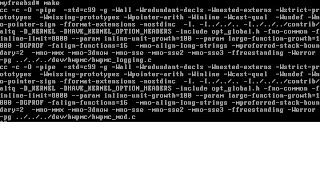
After the make command, we have build our kernel, now run "make install.debug" command and it will install our debug kernel.
Now, it's time to reboot our machine. After rebooting check kernel messages for following message to see if build is successful for profiling enabled kernel Addresses should be different but seeing message "Profiling kernel" means it's ok.
Profiling kernel, textsize=6845824 [c045cbe0..c0ae4160]
It's time to run kgmon to collect profiling data on our kernel.
# kgmon -b
Now kernel profiling is running for low profiling. For high profiling -B option must be used and don't forget you have to use config -pp for high profiling.
You can now, run the application which was causing the problems on your system to profile it, or create the same situation on server where you were having problems.
Now, after creating and seeing the problem, let's kgmon to dump the profiled kernel data.
# kgmon -p
As I said before, kgmon will create a file called gmon.out for profiled data in gprof format.
Now, we gathered our data, we can now stop profiling.
# kgmon -h
We collected the data we need. Let's see what the gmon.out file contains.
# gprof /boot/kernel/kernel gmon.out
Here is a snippet from gprof output.
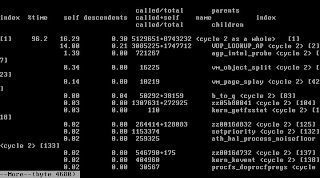
I'll explain the meaning of the gprof output in another post.
NOTE: you can apply this technique to other freebsd deriatives like dragonfly bsd and netbsd.
First of all, we need a profiling enabled kernel configured and build. First step is to use config utility. Now, we need to run config utility from our kernel source configuration directory. I'm using a i386 system. The conf file directory depends on your architecture.
The default directory is /usr/src/sys/ARCH/conf. In my case it's /usr/src/sys/i386/conf/.
We run config utility from where our kernel conf file resides with parameter -p. This tell's the compiler to compile our kernel for low resolution profiling. If we need a high resolution profiling we need to run config with -pp parameter instead of -p. config utility needs a second parameter called SYSTEM_NAME. This is our default system name. FreeBSD's default system name is GENERIC. This can be different on your system, if you build a new kernel with different config file. Older versions of freebsd default GENERIC kernels was not using smp. So it's possible to you have build a new kernel for smp.Therefore you can have a custom build kernel on your system or for another reason. You can see your default system name by using "uname -a" command.
Here is mine is called TESTKERNEL. You'll probably see GENERIC in your case.

After learning you SYSTEM NAME, it's now time to configure our kernel source for profiling. The following picture shows you how to run config with -p option on i386 arch with GENERIC system name.

After running "make cleandepend && depend" command, we run the "make" command on the same directory and it will built a profiling enabled kernel for us.

After the make command, we have build our kernel, now run "make install.debug" command and it will install our debug kernel.
Now, it's time to reboot our machine. After rebooting check kernel messages for following message to see if build is successful for profiling enabled kernel Addresses should be different but seeing message "Profiling kernel" means it's ok.
Profiling kernel, textsize=6845824 [c045cbe0..c0ae4160]
It's time to run kgmon to collect profiling data on our kernel.
# kgmon -b
Now kernel profiling is running for low profiling. For high profiling -B option must be used and don't forget you have to use config -pp for high profiling.
You can now, run the application which was causing the problems on your system to profile it, or create the same situation on server where you were having problems.
Now, after creating and seeing the problem, let's kgmon to dump the profiled kernel data.
# kgmon -p
As I said before, kgmon will create a file called gmon.out for profiled data in gprof format.
Now, we gathered our data, we can now stop profiling.
# kgmon -h
We collected the data we need. Let's see what the gmon.out file contains.
# gprof /boot/kernel/kernel gmon.out
Here is a snippet from gprof output.

I'll explain the meaning of the gprof output in another post.
NOTE: you can apply this technique to other freebsd deriatives like dragonfly bsd and netbsd.
Thursday, January 29, 2009
simple tcp server with djb tcpserver
DJB ucspi-tcp package has a program called tcpserver. Simply it accepts incoming tcp connections for a given port and run specified program when a connection established on that port. The good part is that you can write a program in any language which reads stdin and writes data to stdout file descriptors. In this way, you can read data coming from tcp socket simply by stdin file descriptor and send data to tcp client side by writing desired data on stdout file descriptor.
Here is a simple perl code snippet which reads stdin and writes data to stdout.
#!/usr/bin/perl
$| = 1;
print "Hello !\r\n";
while ($line=<STDIN>) {
print "Your input is:".$line."\r\n";
}
Let's call this file as simple.pl
Here is the tcpserver command to run this program on port 9090. tcpserver has other parameters such as given uid and gid to running process. Please see tcpserver man page for details.
# tcpserver -vRH -l test 0 9090 simple.pl
now, you can telnet your server's 9090 port from another machine and test it.
Here is a simple perl code snippet which reads stdin and writes data to stdout.
#!/usr/bin/perl
$| = 1;
print "Hello !\r\n";
while ($line=<STDIN>) {
print "Your input is:".$line."\r\n";
}
Let's call this file as simple.pl
Here is the tcpserver command to run this program on port 9090. tcpserver has other parameters such as given uid and gid to running process. Please see tcpserver man page for details.
# tcpserver -vRH -l test 0 9090 simple.pl
now, you can telnet your server's 9090 port from another machine and test it.
Subscribe to:
Posts (Atom)