Tuesday, February 3, 2009

Solaris pargs command

Solaris pargs gives you environment and arguments information for any given process id. If you pass just a process id (pid) to pargs, it gives you all argument variables of the running process. If you need to have arguments as a single line for using it with for example on shell use -l argument with it. Also pargs can give you environment information of any running process if you run it with -e parameter.
Sometimes this utility can be handy if you cannot see the parameters or environment variables of a process with other methods like ps or any other well known utilities.

pargs

Friday, January 30, 2009

FreeBSD kernel profiling with kgmon

Sometimes, it's not possible to find a system bottleneck by profiling and debugging user space processess. You have to profile the kernel to pinpoint the perfomance bottleneck. Here, I will show how to configure a freebsd system for kernel profiling and using kgmon utility to gather kernel profiling data. kgmon produces gprof compatible output. The default output file is called gmon.out .

First of all, we need a profiling enabled kernel configured and build. First step is to use config utility. Now, we need to run config utility from our kernel source configuration directory. I'm using a i386 system. The conf file directory depends on your architecture.
The default directory is /usr/src/sys/ARCH/conf. In my case it's /usr/src/sys/i386/conf/.
We run config utility from where our kernel conf file resides with parameter -p. This tell's the compiler to compile our kernel for low resolution profiling. If we need a high resolution profiling we need to run config with -pp parameter instead of -p. config utility needs a second parameter called SYSTEM_NAME. This is our default system name. FreeBSD's default system name is GENERIC. This can be different on your system, if you build a new kernel with different config file. Older versions of freebsd default GENERIC kernels was not using smp. So it's possible to you have build a new kernel for smp.Therefore you can have a custom build kernel on your system or for another reason. You can see your default system name by using "uname -a" command.
Here is mine is called TESTKERNEL. You'll probably see GENERIC in your case.
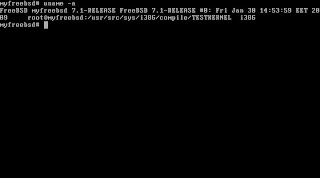


After learning you SYSTEM NAME, it's now time to configure our kernel source for profiling. The following picture shows you how to run config with -p option on i386 arch with GENERIC system name.
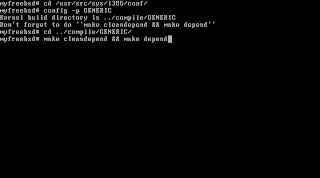


After running "make cleandepend && depend" command, we run the "make" command on the same directory and it will built a profiling enabled kernel for us.
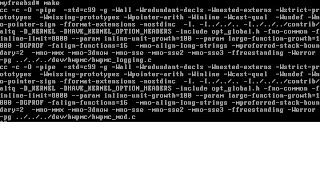


After the make command, we have build our kernel, now run "make install.debug" command and it will install our debug kernel.

Now, it's time to reboot our machine. After rebooting check kernel messages for following message to see if build is successful for profiling enabled kernel Addresses should be different but seeing message "Profiling kernel" means it's ok.

Profiling kernel, textsize=6845824 [c045cbe0..c0ae4160]

It's time to run kgmon to collect profiling data on our kernel.

# kgmon -b

Now kernel profiling is running for low profiling. For high profiling -B option must be used and don't forget you have to use config -pp for high profiling.
You can now, run the application which was causing the problems on your system to profile it, or create the same situation on server where you were having problems.
Now, after creating and seeing the problem, let's kgmon to dump the profiled kernel data.

# kgmon -p

As I said before, kgmon will create a file called gmon.out for profiled data in gprof format.

Now, we gathered our data, we can now stop profiling.

# kgmon -h

We collected the data we need. Let's see what the gmon.out file contains.

# gprof /boot/kernel/kernel gmon.out

Here is a snippet from gprof output.
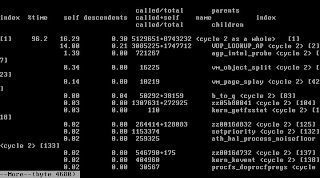


I'll explain the meaning of the gprof output in another post.

NOTE: you can apply this technique to other freebsd deriatives like dragonfly bsd and netbsd.

Thursday, January 29, 2009

simple tcp server with djb tcpserver

DJB ucspi-tcp package has a program called tcpserver. Simply it accepts incoming tcp connections for a given port and run specified program when a connection established on that port. The good part is that you can write a program in any language which reads stdin and writes data to stdout file descriptors. In this way, you can read data coming from tcp socket simply by stdin file descriptor and send data to tcp client side by writing desired data on stdout file descriptor.

Here is a simple perl code snippet which reads stdin and writes data to stdout.

#!/usr/bin/perl


$| = 1;
print "Hello !\r\n";

while ($line=<STDIN>) {

print "Your input is:".$line."\r\n";

}

Let's call this file as simple.pl
Here is the tcpserver command to run this program on port 9090. tcpserver has other parameters such as given uid and gid to running process. Please see tcpserver man page for details.

# tcpserver -vRH -l test 0 9090 simple.pl

now, you can telnet your server's 9090 port from another machine and test it.

lsof alternatives on FreeBSD

lsof is a utility which gives information about open sockets/files/pipes on many unix systems. You can easily install lsof and try it on your freebsd installation by using pkg_add command.

# pkg_add -r lsof

But FreeBSD has two utilities coming bundled with default installation. They are called fstat and sockstat.

fstat tells you which user,command and pid opened the file, which mount point the file is and information about the open file descriptor like read/write, inode number and mount point of the opened file.Please see man page of fstat for other options.

sockstat gives you information about the opened sockets like which process/command is using it, user of the process,pid,protocol like tcp/udp,stream,dgram,etc.. and connected ports of local and remote servers.

Saturday, January 24, 2009

Freebsd kernel process tracing

ktrace utility enables to trace and log kernel system calls made by process. By default, it logs to ktrace.out file but this can be overwritten by providing another log filename with -f parameter. You need to pass your command to ktrace or use the pid of a running process.
Also you have to say the kernel what system calls to trace by -t parameter. -t parameter has following options:

c trace system calls
n trace namei translations
i trace I/O
s trace signal processing
t trace various structures
u userland traces
w context switches
+ trace the default set of trace points - c, n, i, s, t, u

While tracing is going in kernel , logging stops when the process stops execution or trace popint ends. The other way is to use -c parameter of the ktrace and provide the pid of the process to stop tracing any further.

to trace and log any running processes simply use the -p parameter and pass the process number (pid) to ktrace. here is a simple example with ktrace to trace find command:

# ktrace -t+w /usr/bin/find /

and following is a short snippet from the log created by ktrace and dispayled using kdump utility

# kdump -f ktrace.out


The log file created by ktrace can be read with kdump utility. Simply pass your ktrace log filename to kdump with -f parameter.

Thursday, January 22, 2009

freebsd network tuning

Few days ago, I couldn't reach on of my freebsd 7.1 servers via ssh. Machine was not giving any response to any packets on the network. This is a server which gets moderate network traffic created by short and long lived network connections. After log in from console, I ran the "vmstat -z" command.
Looking closely to vmstat -z output, I figured out that some kernel zone allocations failed for following zones:
mbuf_cluster: 2048, 25600, 1278, 24322, 393553280, 1384
tcptw: 52, 5184, 0, 5184, 3348441, 1304539
tcpreass: 20, 1690, 0, 1690, 10759020, 503124

simply,
tcptw -> tcp timewait
tcpreass -> tcp reassembly
mbuf_cluser -> network buffer data stored by freebsd kernel

I decided to bump the default numbers. I have used /etc/sysctl.conf to increase
net.inet.tcp.maxtcptw = 12000
kern.ipc.nmbclusters = 32768

numbers. then run /etc/rc.d/sysctl restart. you can run vmstat -z to see if the numbers are in effect. tcpreass is a bit different. It should be written in /boot/loader.conf file and will take effect after rebooting your machine.

net.inet.tcp.reass.maxsegments = 4096

After rebooting my machine I checked the results but I didn't get tcpreass numbers as I wrote to boot loader.conf file. I decided to look what happened. I examined the freebsd 7.1 kernel sources and see tcp_reass_init() has an EVENTHANDLER_REGISTER which calls tcp_reass_zone_change() function when nmbclusters numbers changed by sysctl. The rule is simple, when the machine boots
tcp_reass_init functions calculates tcpreass default value as nmbclusters / 16. But if you add net.inet.tcp.reass.maxsegments to your boot loader it skips the auto calculated default and gets the number you've given. Then as default register a event handler to watch nmbclusters changes by users for auto calculate tcpreass again.In my case it gets the given number but when systcl gets into the account kernel detects that nmbclusters changed and recalculates it. So, I decied to remove my parameter from boot loader.conf and instead of that increase the mbuf cluster number to a little bit higer via sysctl.conf. The reasons here is that tcpreass queue uses mbufs, therefore it's auto tuned by freebsd kernel to not run out of mbuf clusters on system.


NOTE: put this accounting that each mbuf cluster allocates 2KB in memory.

Friday, January 9, 2009

profiling performance of an erlang application with eprof

Sometimes it's hard to pinpoint performance problems. In this cases profiling tools come handy. One of the profiling tools in Erlang is called eprof. Here is a simple example how to profile your erlang application with eprof.
First of all, you need to find which pid (module) to profile. You can use "nregs()." command to find your application's pid number in erl shell. In my case pid number is "<0.34.0>".
After finding the pid number start eprof module:

eprof:start().

now tell eprof to start profiling your application by giving the pid number.

eprof:start_profiling([pid(0,34,0)]).

note here that I have changed the dot in pid number to commas.

now wait sometime for eprof to collect some data or did something where you think the application was responding slow or stalling the cpu or whatever.

now stop profiling.

eprof:stop_profiling().

ok now we can see which functions was occupying our cpu with following command:

eprof:total_analyse().


Here is some screen output for total_analyse from my case:
6> eprof:total_analyse().
FUNCTION CALLS TIME
file:file_name_1/1 3450 13 %
erlang:port_control/3 250 7 %
prim_inet:enc_opts/2 300 5 %
erlang:port_command/2 50 4 %
erlang:port_close/1 50 4 %
prim_inet:enc_opt_val/4 300 3 %
gen:wait_resp_mon/3 200 3 %
filename:do_flatten/2 650 3 %
gen:do_call/4 200 2 %
prim_inet:dec_opt_val/3 300 2 %

if you like to see results for process by process use "analyse()" instead of "total_analyse()"
Also,It's possible to log these results to file by eprof's "log" function.